Increased capillary dropout is associated with worsening diabetic retinopathy, regardless of metabolic control and disease duration.
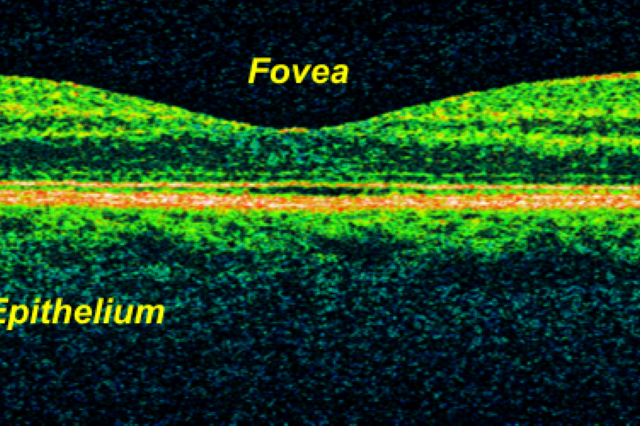
An OCT colored image of the retina, with the parts labeled. Source via CC-BY-2.0.
Optical coherence tomography (OCT) is a non-invasive strategy to image retinal structures, while OCT angiography (OCTA) is an extended application that can detect motion or blood flow contrast. It is used to visualize retinal and choroidal vasculature and is non-invasive as it does not require the use of an intravenous dye. Both OCT and OCTA are helpful in evaluating patients with diabetes. Structural OCT can be used to observe retinal nerve fiber layer (RNFL) and ganglion cell and inner plexiform layers (GCL-IPL) thinning, as well as retinal thickening, which is indicative of edema. OCTA can be used to observe the density of vessels in the macula and the size of the foveal avascular zone (FAZ). Thus, OCT can be used to monitor diabetic retinopathy resulting from three pathophysiological changes: neurodegeneration due to apoptosis, leaking microvasculature (edema and hemorrhages), and microvascular changes in perfusion (ischemia).
A previous study showed that only ischemic mechanisms, manifesting as capillary dropout, showed correlation with the severity of retinopathy and with disease control. In this 2-year prospective longitudinal cohort study, patients with non-proliferative diabetic retinopathy (NPDR) were enrolled. They underwent a full eye examination and OCT imaging, and other clinical factors were obtained, such as age, duration of diabetes, diabetic control (based on hemoglobin A1C), and blood pressure. Evaluations of 62 eyes were done on a yearly basis for 2 years, and classification was performed according to seven-field Early Treatment Diabetic Retinopathy Study (ETDRS).
A total of 44 eyes were included in the analysis with varying ETDRS grades. Throughout the study period, there was a progressive increase in capillary dropout, while retinal edema and neurodegeneration didn’t change. With a multivariate analysis adjusting for age, sex, diabetic control, visual acuity, and duration of diabetes, vessel density was still significantly different across the ETDRS groups. This indicates that vessel density is associated with disease progression.
Marques, I., Alves, D., Santos, T., Mendes, L., Lobo, C., & Santos, A. et al. (2020). Characterization of Disease Progression in the Initial Stages of Retinopathy in Type 2 Diabetes: A 2-Year Longitudinal Study. Investigative Ophthalmology & Visual Science, 61(3), 20. https://doi.org/10.1167/iovs.61.3.20